Ambyint
Helping operators move between short-term events and long-term trends without losing context.
The existing analysis experience contained the information operators needed, but connecting it into a meaningful decision required constant context switching. This redesign explored how interaction design, information architecture and reusable product patterns could make enterprise well analysis easier to understand and act on.
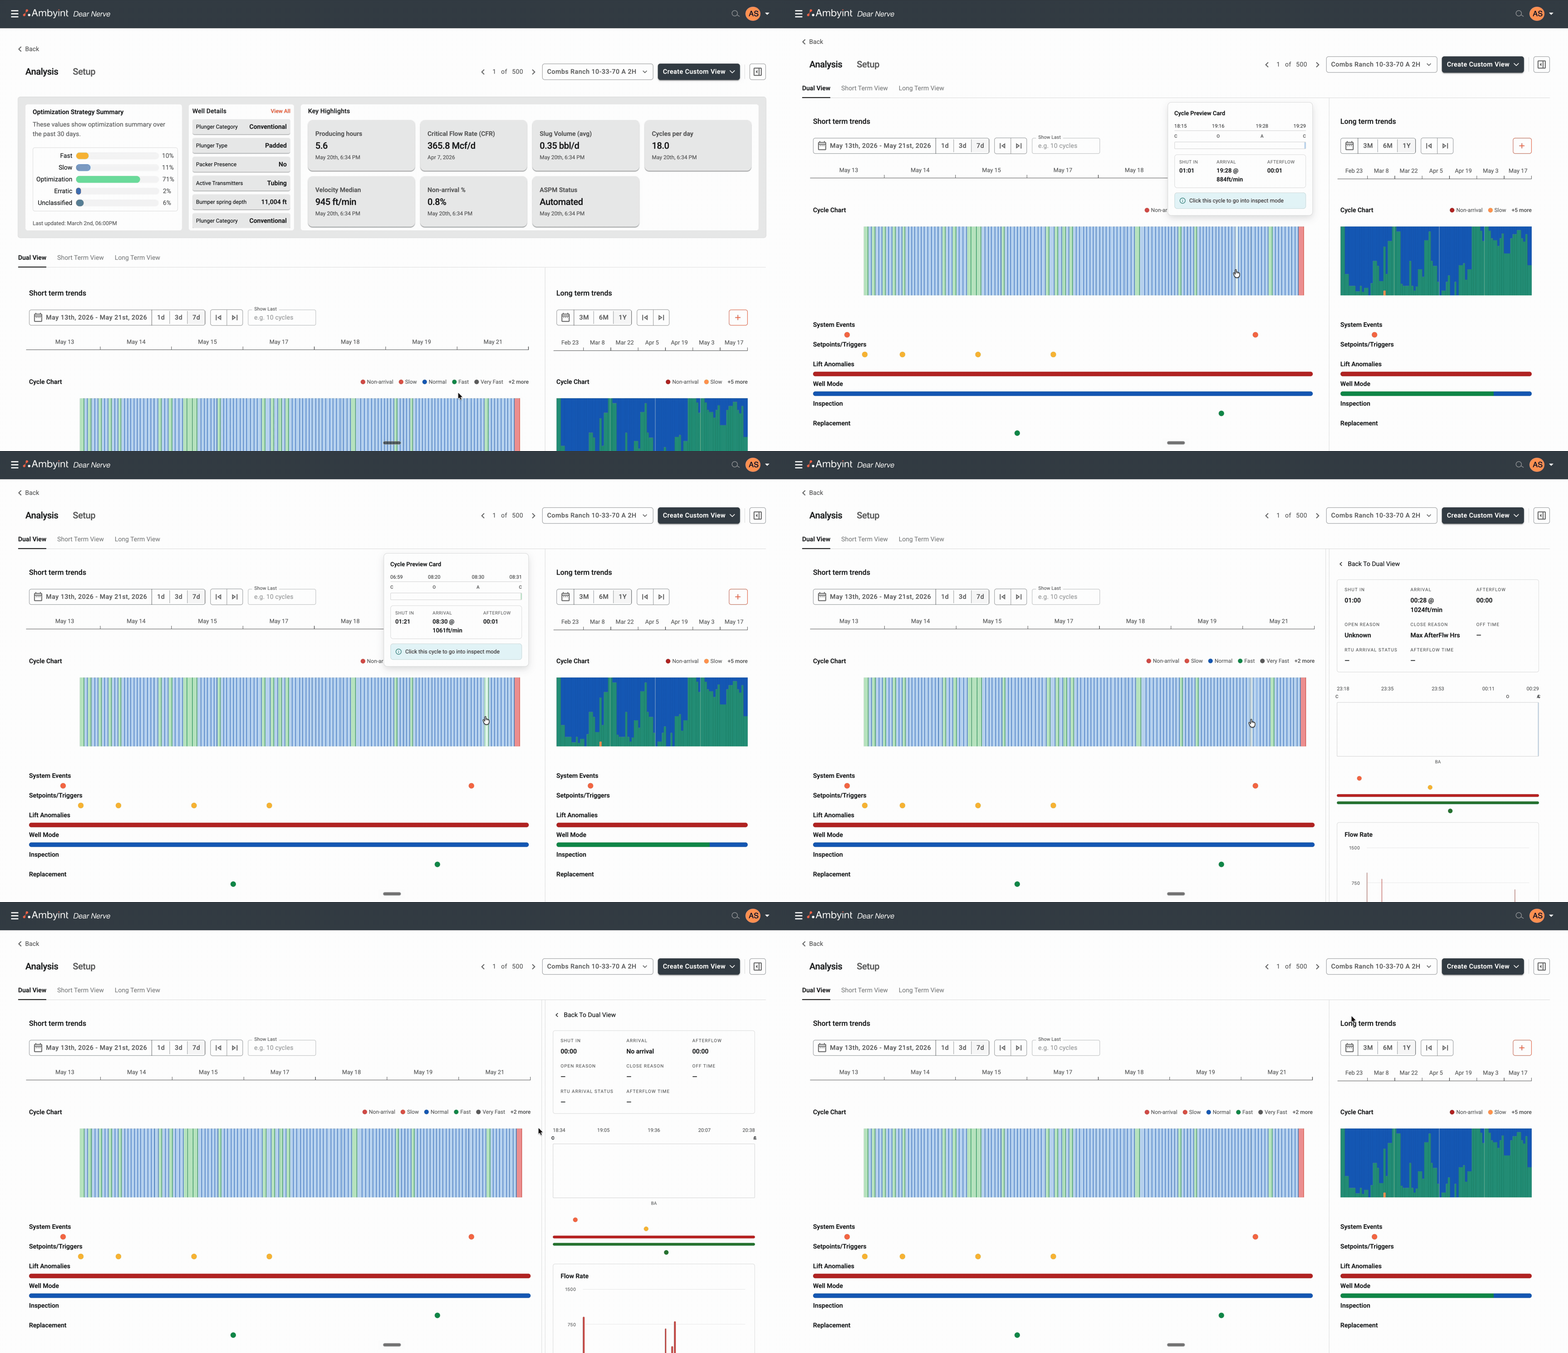
Operators had the data. Understanding it was the difficult part.
The platform presented multiple sources of operational data, but users still needed to mentally connect recent cycles, long-term performance, events and well information before making decisions.
The challenge wasn't missing information. It was preserving context while moving between different levels of detail.
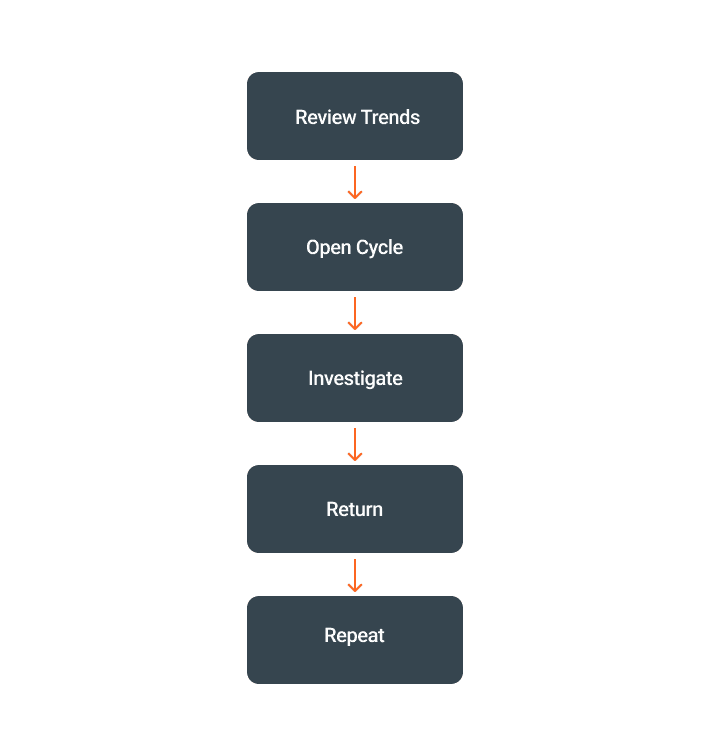
Analysis is less about displaying data than supporting decisions.
Through product conversations, design exploration and engineering feasibility work, a consistent theme emerged.
Operators rarely consume charts independently. Instead they compare multiple signals simultaneously while trying to answer one operational question:
“Why is this well behaving differently today?”
This insight became the foundation for the redesign.
From presenting information to preserving context.
Rather than treating every chart and panel as an independent feature, we began redesigning the page as one connected analysis workspace.
Every interaction should help users move between recent activity, historical behaviour and supporting information without losing their place.
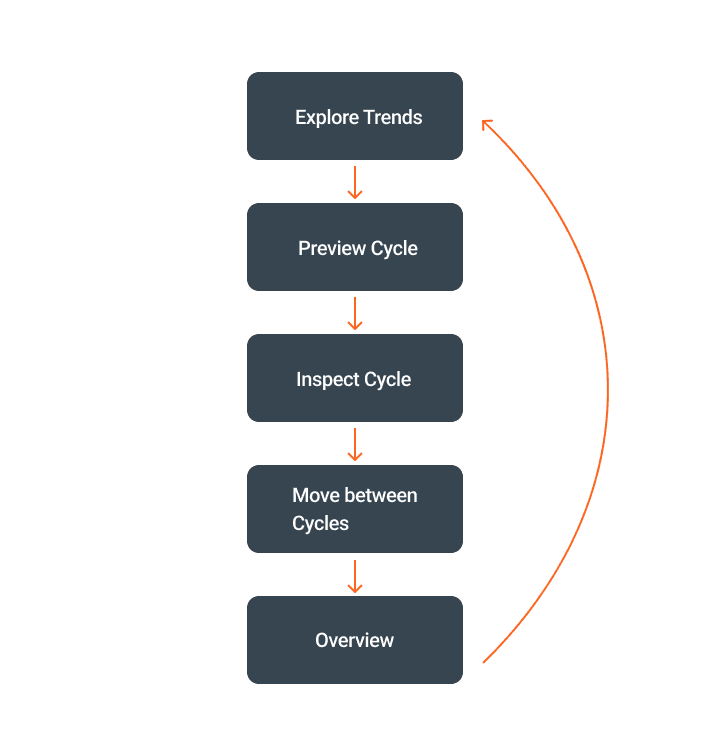
Three principles guided the redesign.
Maintain context across time horizons.
Users should move naturally between recent cycles and historical trends.
Progressively reveal complexity.
Surface important information first while allowing deeper inspection without overwhelming the interface.
Design reusable analysis patterns.
Components should solve today's workflow while creating consistent foundations for future analysis experiences.
A new interaction model for enterprise analysis.
- Separate charts
- Fragmented context
- Manual correlation
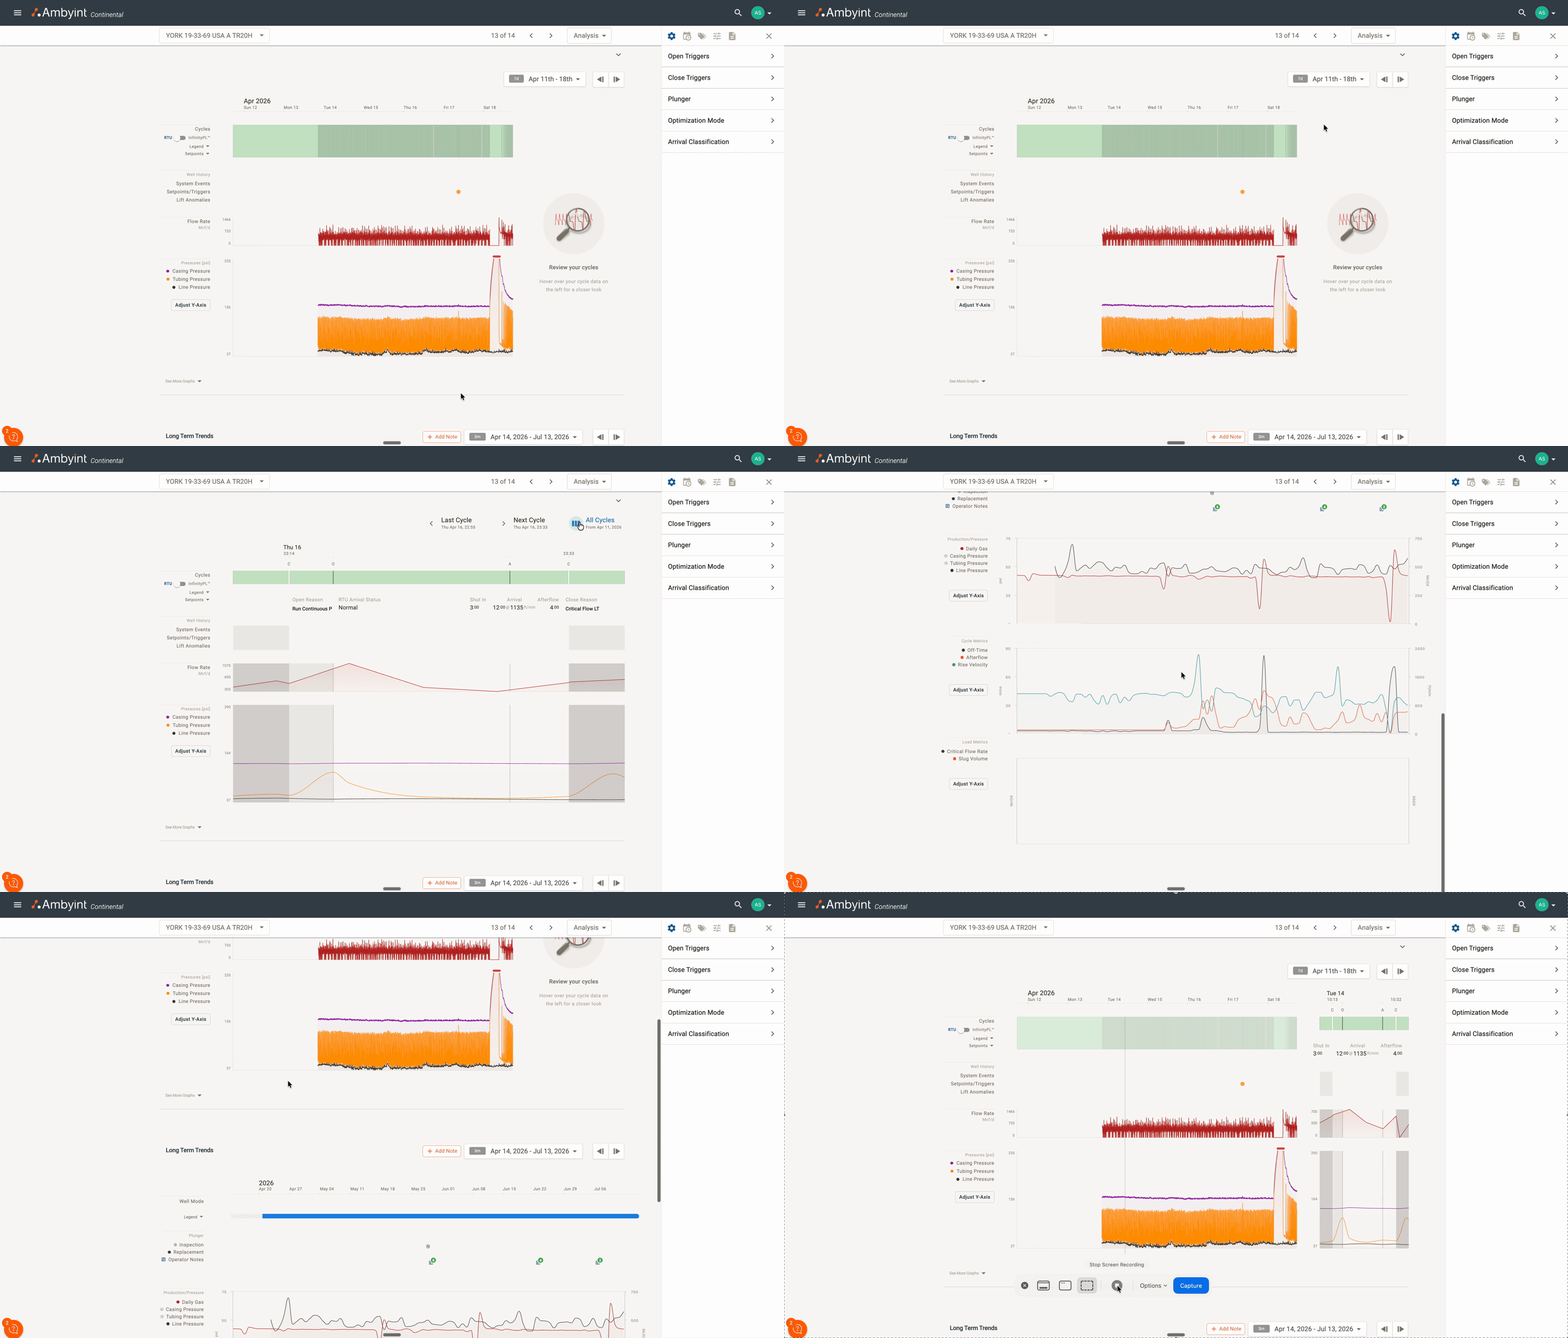
- Connected analysis
- Dual view
- Progressive inspection
- Supporting information integrated into one workflow
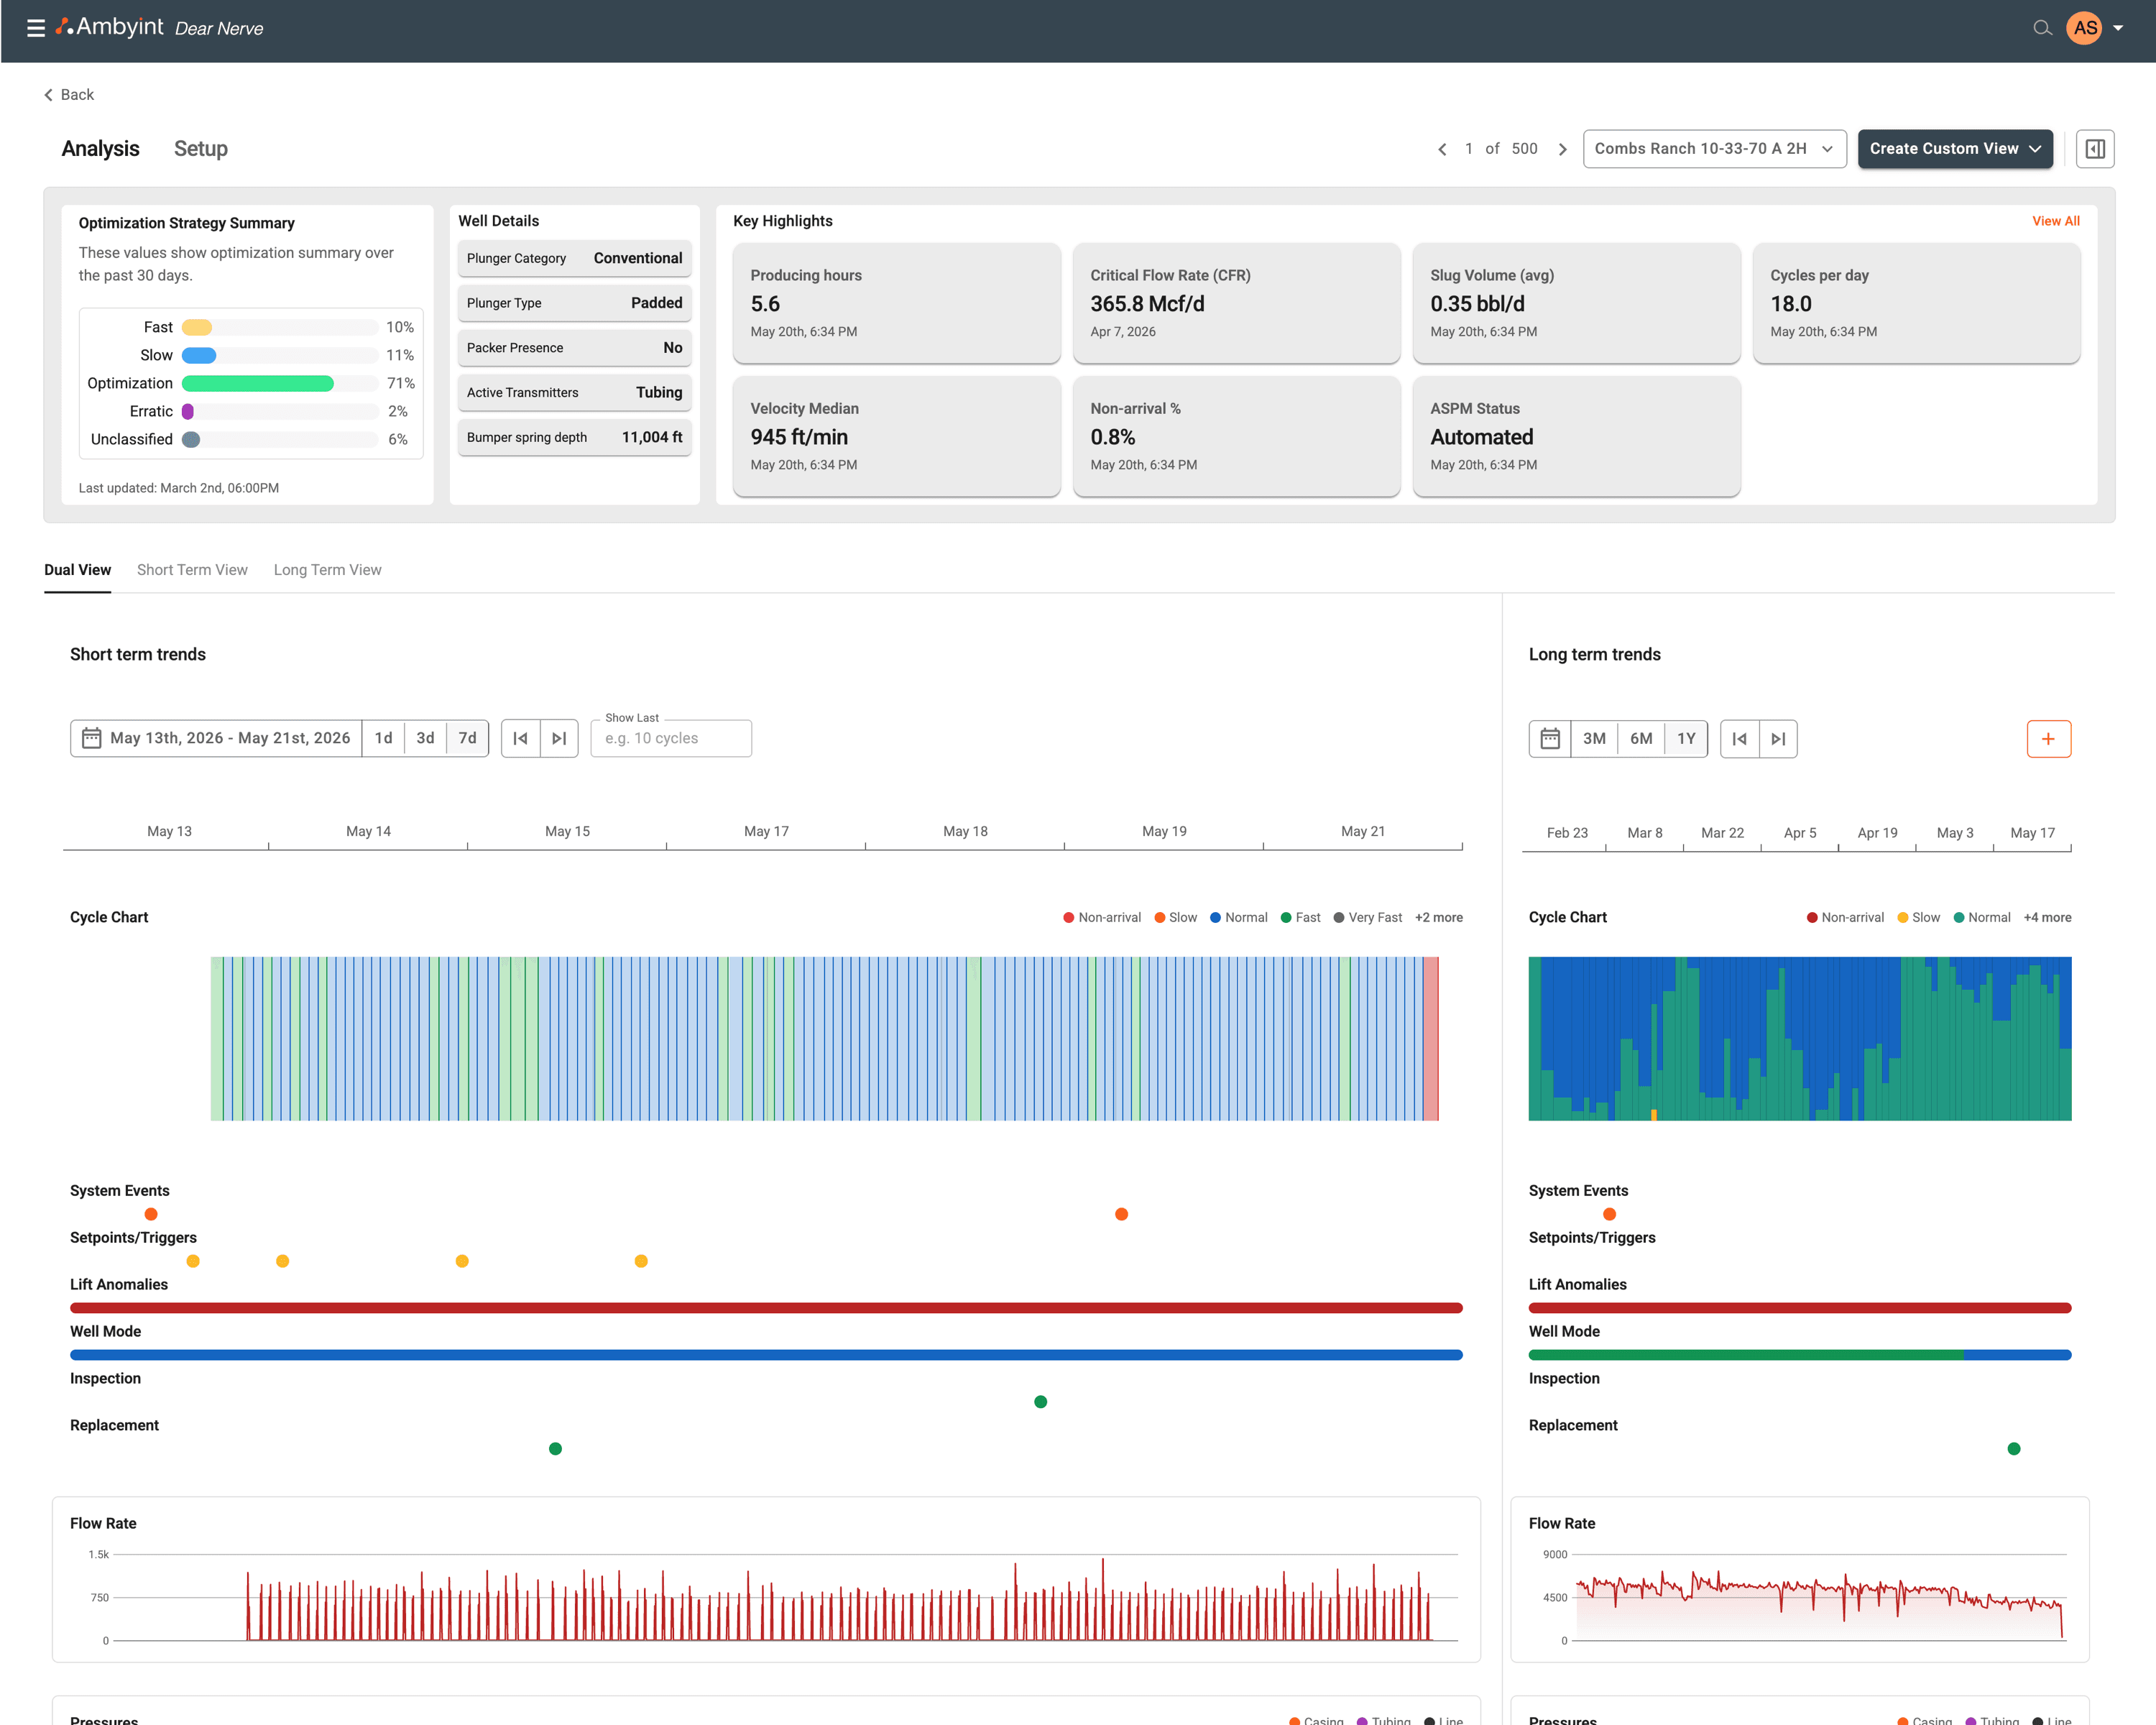
Helping users inspect without losing context.
The Dual View interaction is the core of this redesign. Rather than opening a new page, inspect mode replaces part of the existing workspace — keeping the user oriented within the same analysis context.
Default dual view
Short-term cycles and long-term performance are visible simultaneously. Neither dominates the other.
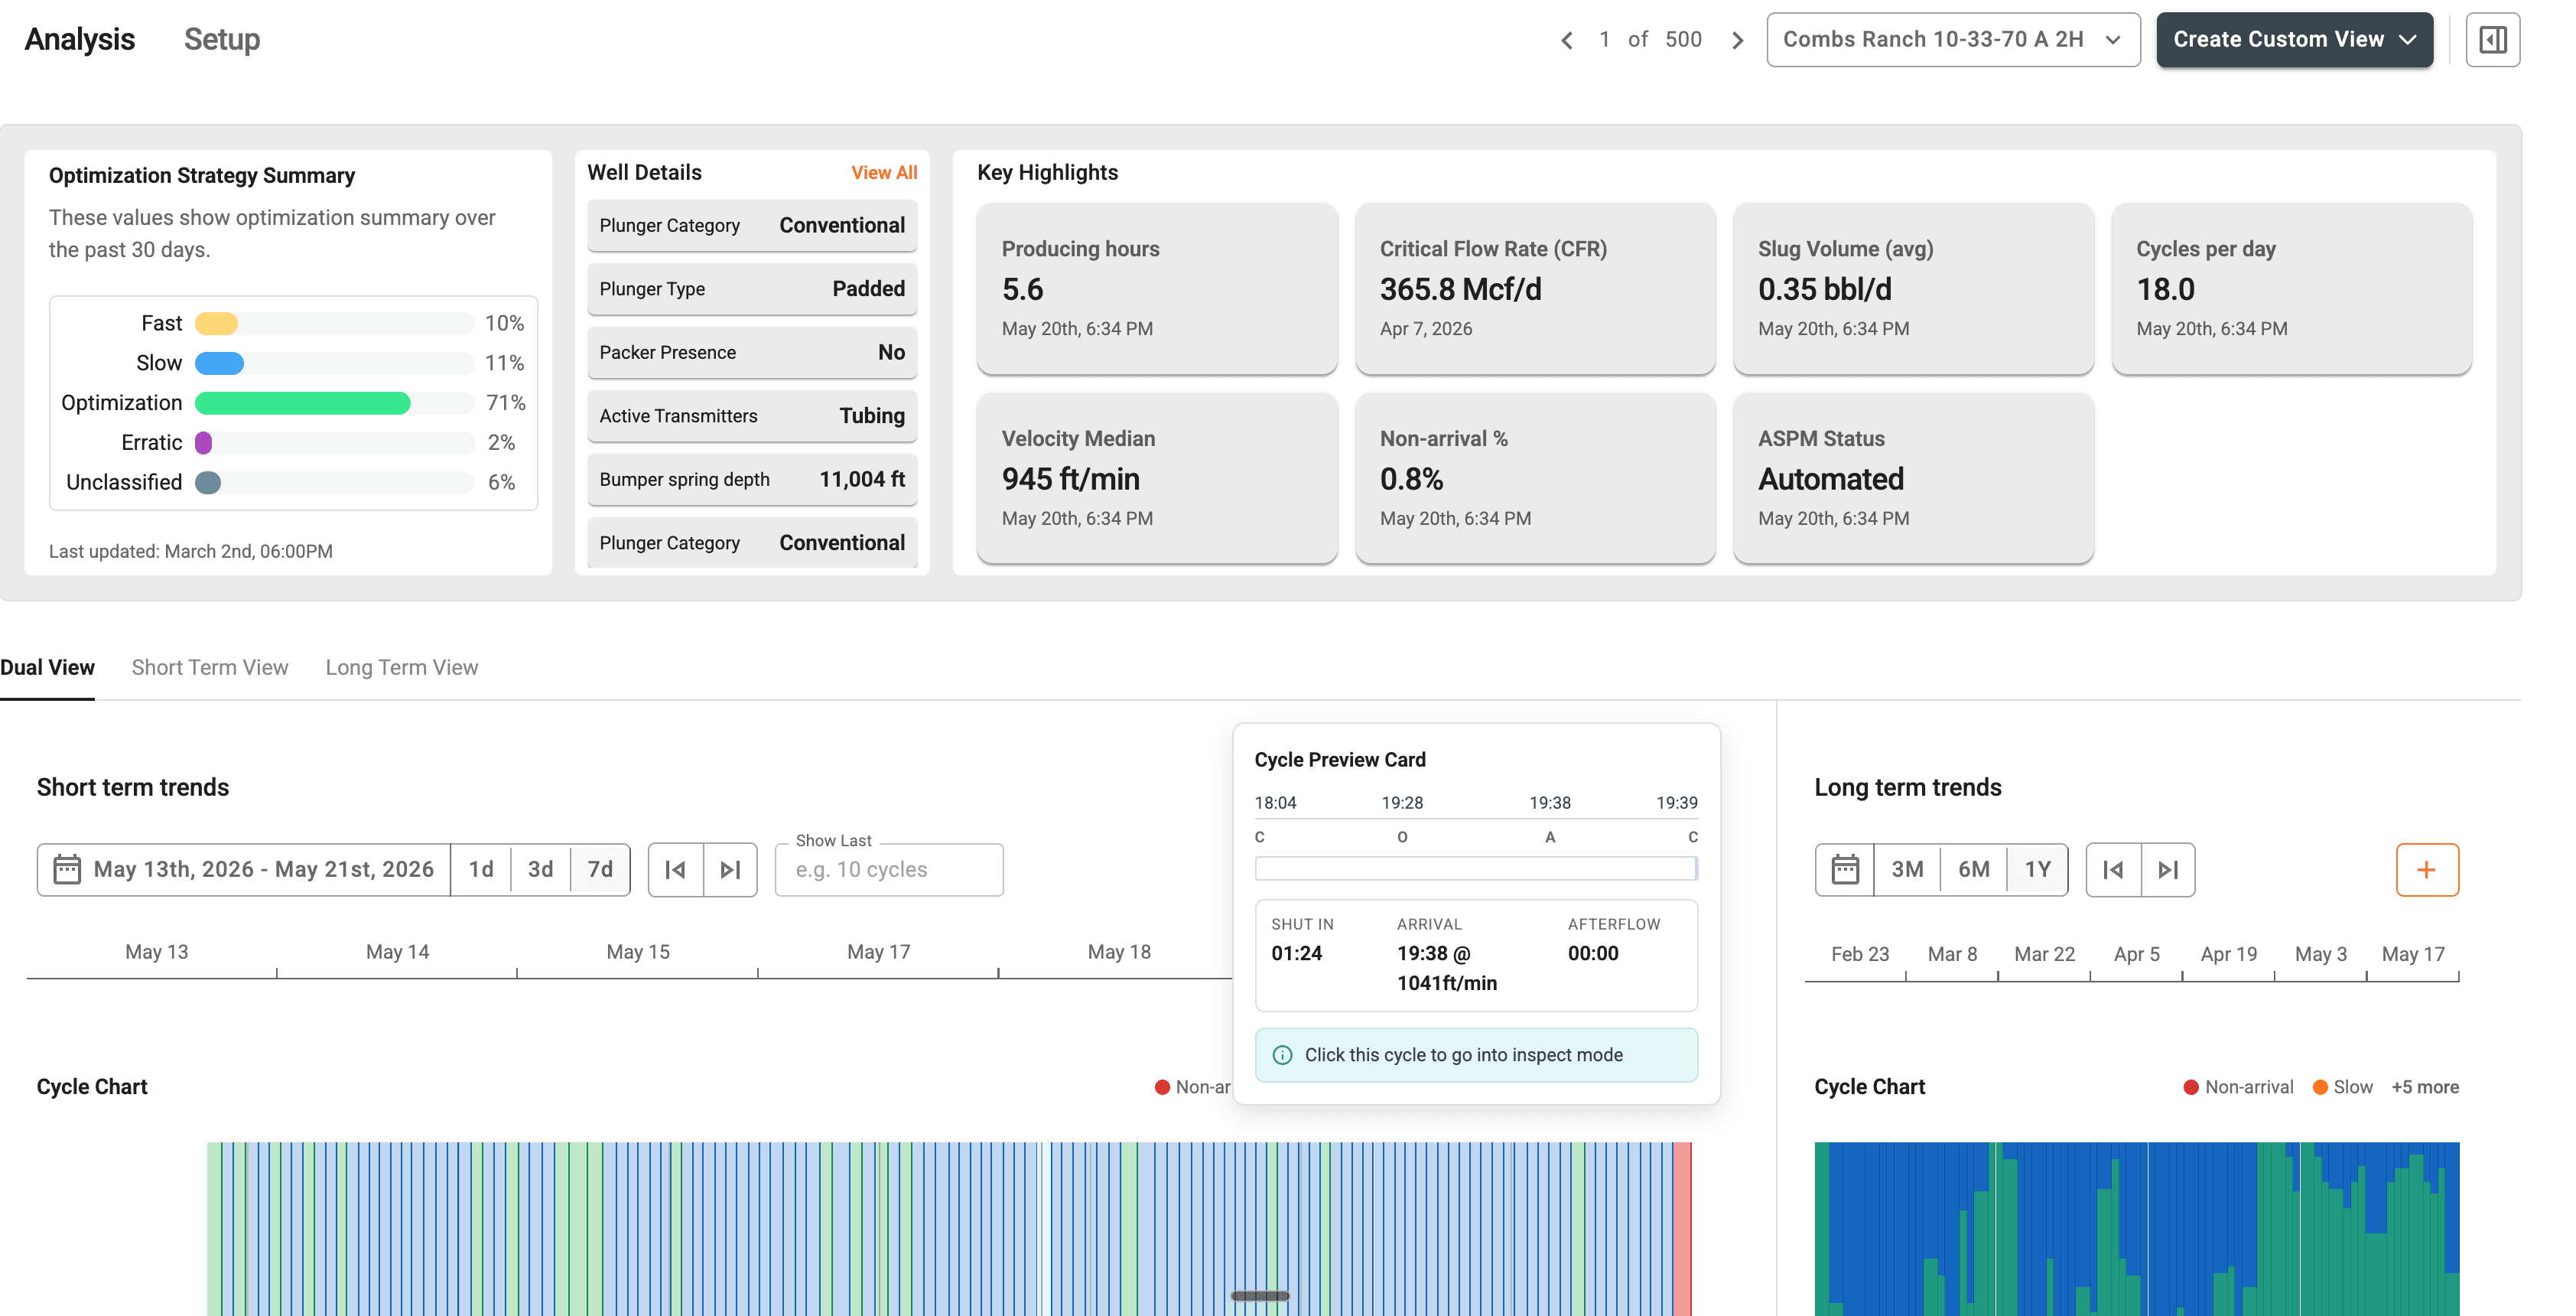
Hover preview
Hovering a data point surfaces contextual detail inline — no navigation required.
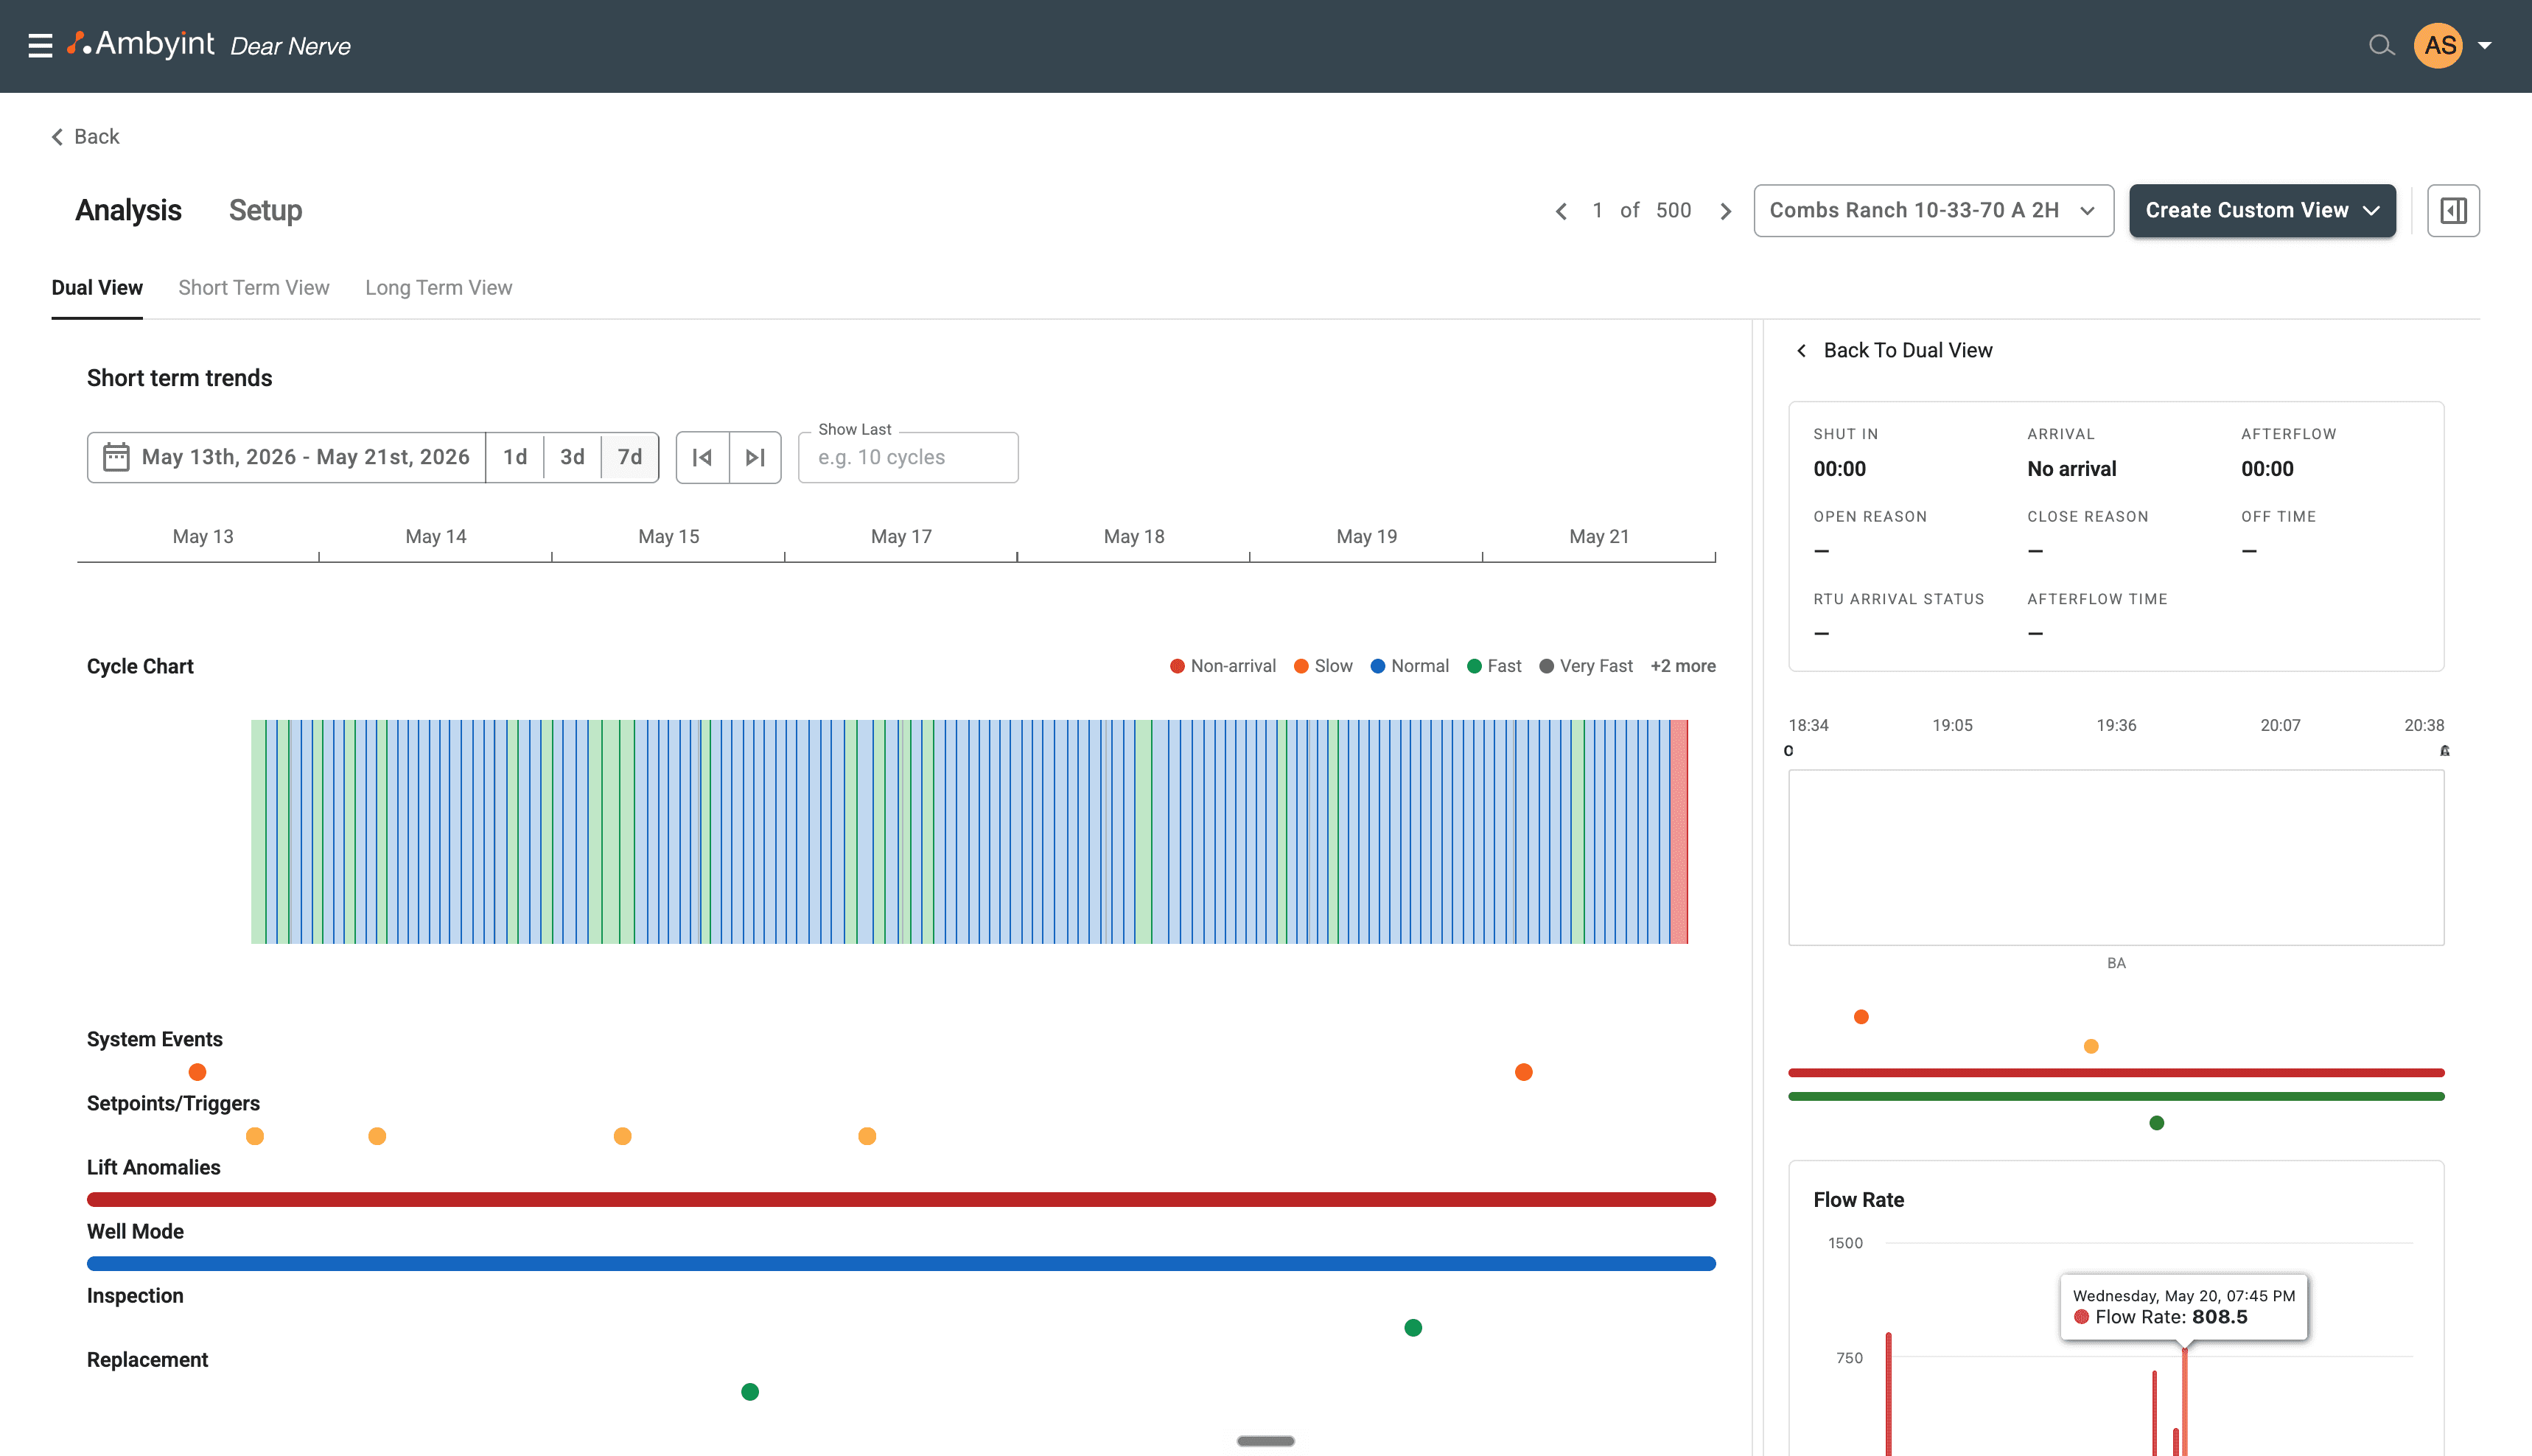
Inspect
Selecting a point replaces part of the workspace with deeper detail. The user stays in the analysis flow.
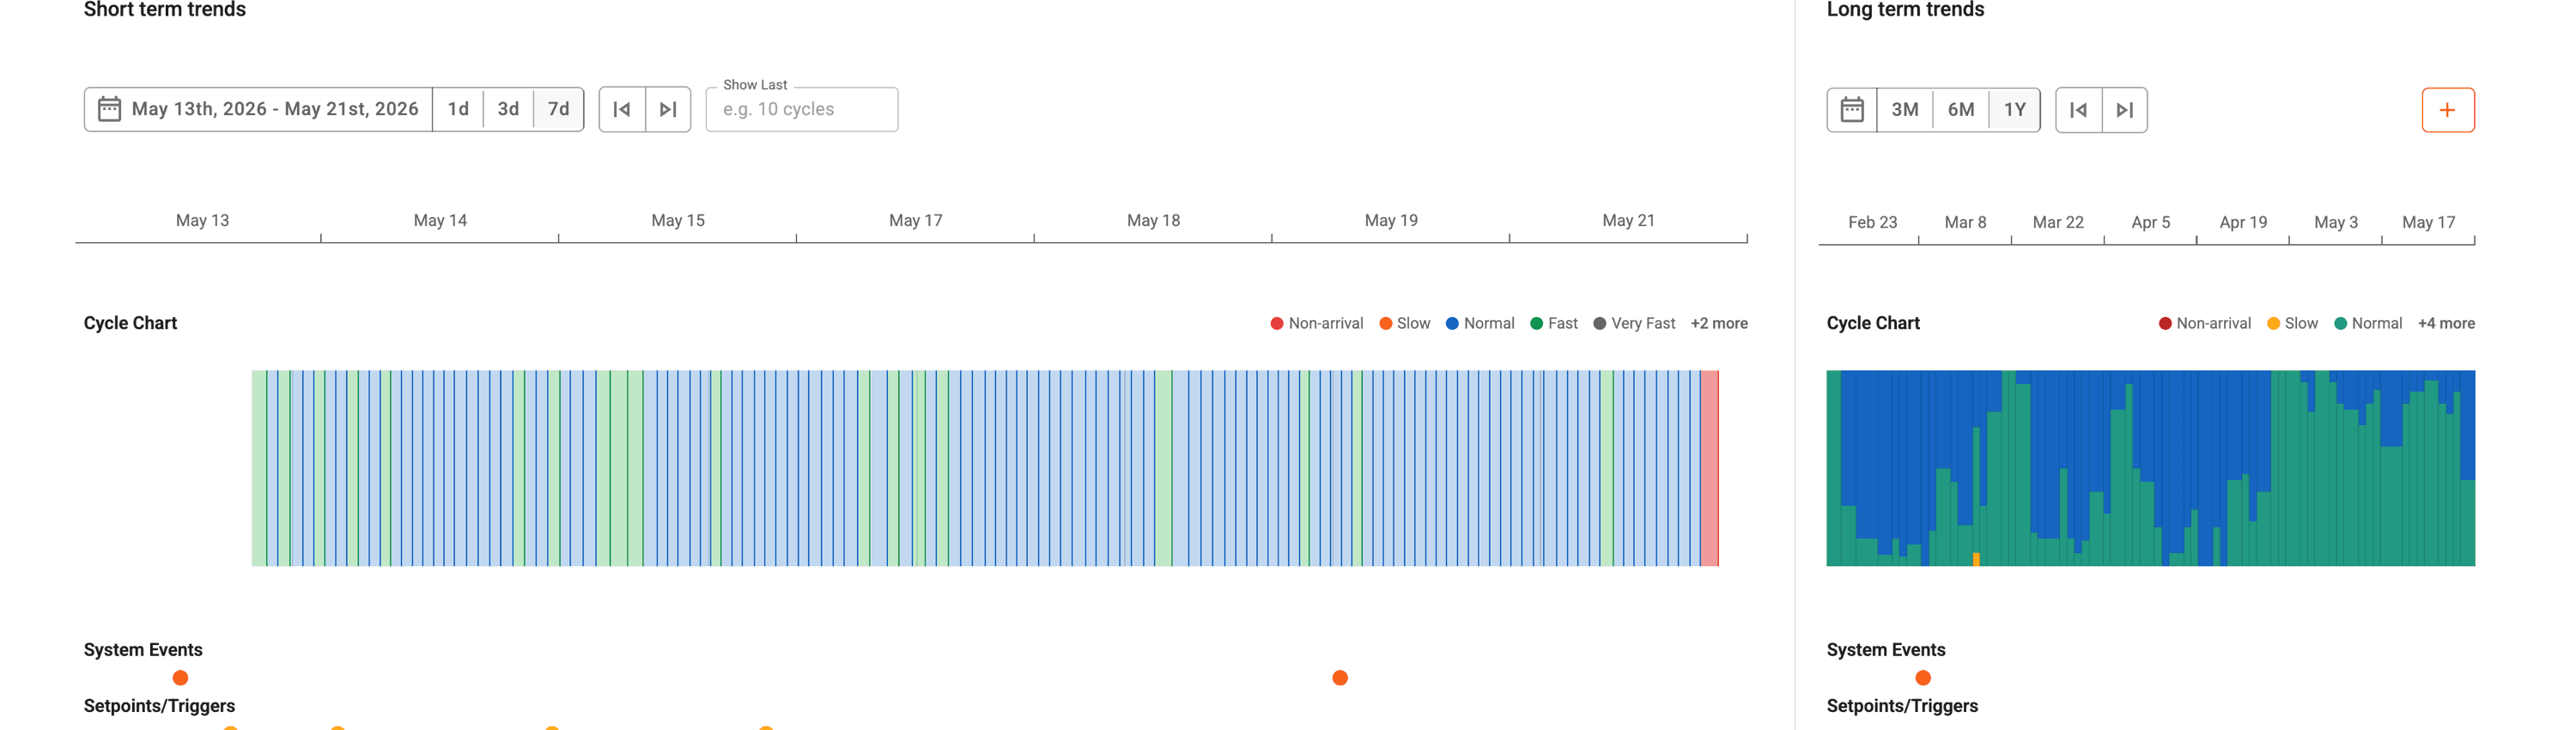
Return
Dismissing restores the original view. No lost scroll position.
Designed as a system, not a collection of features.
Rather than presenting every component independently, the work was grouped into reusable experience patterns — each solving a specific part of the analysis workflow.
Analysis Navigation

Understanding Performance
Operational Context

Supporting States
Designing alongside engineering and product.
This work was never a design handoff. Decisions about interaction model, chart behaviour and data structure were made collaboratively — with engineers and product managers involved throughout.
Engineering feasibility
Early conversations with engineering shaped which interaction ideas were viable within the current architecture.
Highcharts limitations
Working within Highcharts constraints informed the interaction model — specifically how hover and inspect states were designed.
Data availability
Not all desired data was accessible at the point of interaction. Design decisions accounted for what could realistically be shown.
MongoDB questions
Query structure influenced how certain time-series comparisons could be implemented, affecting the dual view behaviour.
Product tradeoffs
Scope decisions were made jointly with product — prioritising the analysis core before extending to peripheral views.
Technical exploration
Some concepts required short technical spikes before design could move forward with confidence.
A foundation for future analysis experiences.
While the redesign continues to evolve, the work has already shaped the direction of the product through validated interaction concepts, reusable design patterns, and engineering collaboration.
Established a new interaction model for well analysis.
Created reusable component patterns that extend beyond a single view.
Validated engineering feasibility across the core interaction states.
Created foundations for custom analysis views.
Unified multiple design initiatives into one analysis system.
Enterprise UX is ultimately about preserving context.
Working on this redesign reinforced that enterprise software rarely suffers from a lack of information. The challenge is helping people connect information while maintaining their mental model of the problem they're trying to solve.
That principle now influences how I approach complex workflows, design systems and interaction design more broadly.